 Mathvsmyth
Cosmology · The Universe in Layers series
The Universe in Layers
The mapped, the observable, and the unknown. We observe the cosmos from inside a set of nested bubbles, and what we have truly charted is a minimal fraction of the sphere we can see. This piece walks those layers along two axes — outward in space, backward in time — with the numbers on the table and how we know each one.
Author: Juan Carlos Euyoque Aguilera · October 24, 2026 · CC BY 4.0 · Version 1.0
Every claim carries its mark: measured data, a model built on data, a marked myth, or an open question. No typed-in percentages: each layer's confidence comes from its declared nodes at the end.
- [DATA] measured data
- [MODEL] interpreted / modeled
- [MYTH] marked myth
- [QUESTION] open question
1 · The honest map
[MYTH] "We have already mapped the universe."
[DATA] We have measured the distances of some 40 million galaxies, out of an estimated 200 billion or more inside the observable sphere: roughly 1 in 5,000. The filaments of the cosmic web are charted in detail only in our neighborhood; the rest is sampled in narrow survey wedges, like drill cores in an ocean.
[MYTH] "The observable universe is 27.6 billion light-years across — the age times two."
[DATA] It spans ~93 billion light-years. Age is not size: while the light traveled toward us, space itself expanded, so the source of the oldest light now sits ~46.5 billion light-years away. The "just double it" intuition falls short — the real correction is expansion.
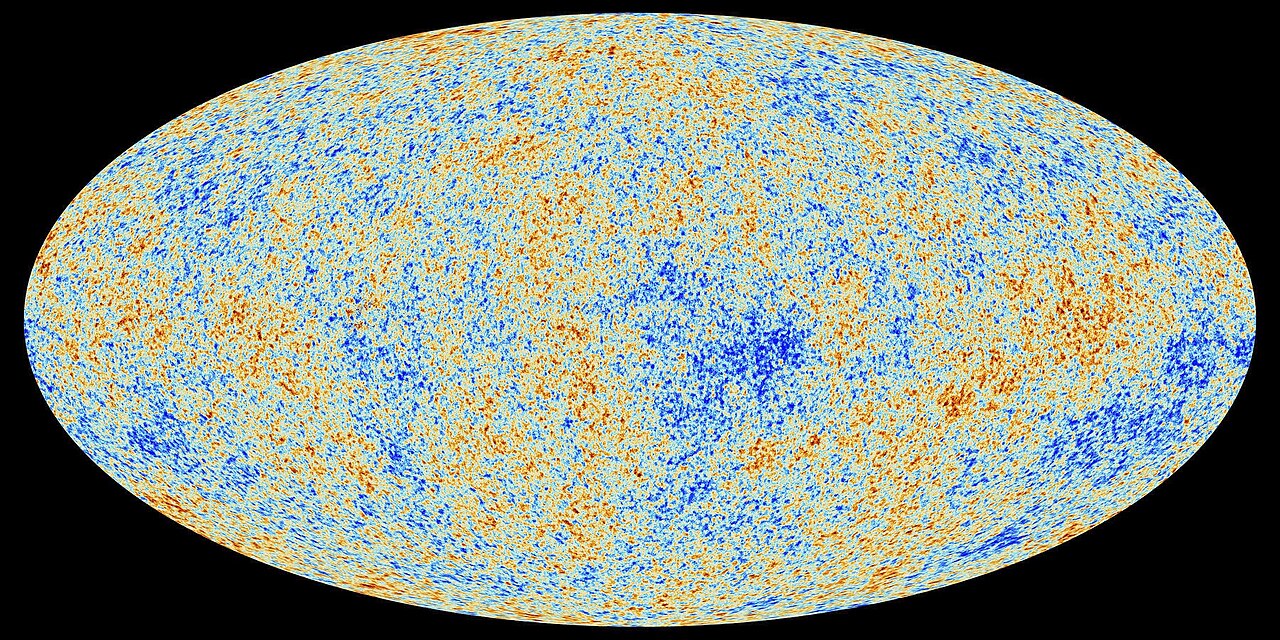
[DATA] The cosmic microwave background covers 100% of the sky — the only complete map we have. But it is a shell: the surface of a single epoch (380,000 years after the Big Bang), not the volume of the universe.
3D visualization: at the center, us; the green speck is the cosmic web mapped in detail (exaggerated ×5 to be visible); the blue wedges are the SDSS/DESI surveys; the orange sphere is the observable universe with the cosmic background as its shell; the outer dotted sphere is the whole, of unknown size. If your browser cannot display it, all of its figures are in this page's text.
Drag to rotate; scroll or pinch to zoom. Scale honesty: the mapped core is exaggerated ~×5; at true scale it would be a nearly invisible speck. The dotted sphere is not an edge: it is the reminder that the size of the whole is unknown.
2 · The journey: twelve layers outward
We live nested. Each layer contains the previous one, and each is known through a different instrument: the history of astronomy is the history of crossing these borders one by one.
1 · Earth's atmosphere
0 to ~10,000 km (exosphere)The first bubble: troposphere (the weather), stratosphere (the ozone), and upward the air thins until it merges with space. Traces of Earth's hydrogen — the geocorona — reach even beyond the Moon's orbit.
How we know: sounding balloons discovered the stratosphere in 1902; today satellites and rockets profile every sublayer, and the SOHO observatory detected the geocorona. [DATA]
2 · The heliosphere
radius ~120 AUThe bubble the solar wind inflates around the Sun. Plainly put: we live inside our star's extended atmosphere.
How we know: Voyager 1 crossed its edge (the heliopause) in 2012 and Voyager 2 in 2018; upon crossing, galactic cosmic rays jumped sharply and the plasma changed character. Two direct measurements, not a model. [DATA]
3 · The Oort cloud
from ~20,000 to ~100,000 AU (~1.5 light-years)The solar system's outermost envelope: a sphere of icy bodies marking the Sun's gravitational frontier and holding the reservoir of long-period comets. No one has seen it directly — it is inferred from the orbits of the comets that fall from it.
How we know: Jan Oort deduced its existence in 1950 from comet trajectories; the Voyager probes, which have already crossed the heliosphere, will take some 300 years to reach its inner edge and ~30,000 to pass through it. [MODEL]
4 · The Local Bubble
hundreds of light-years (~300–1,000 across)A cavity of hot, tenuous gas surrounding the solar system, carved out by some 15 supernovae over the last ~14 million years. The Sun drifted into it ~5 million years ago: we are recent tenants.
How we know: the diffuse soft X-ray background and absorption lines in nearby stars; the supernova chronology was reconstructed in 2022 (Zucker et al., Nature). [MODEL]
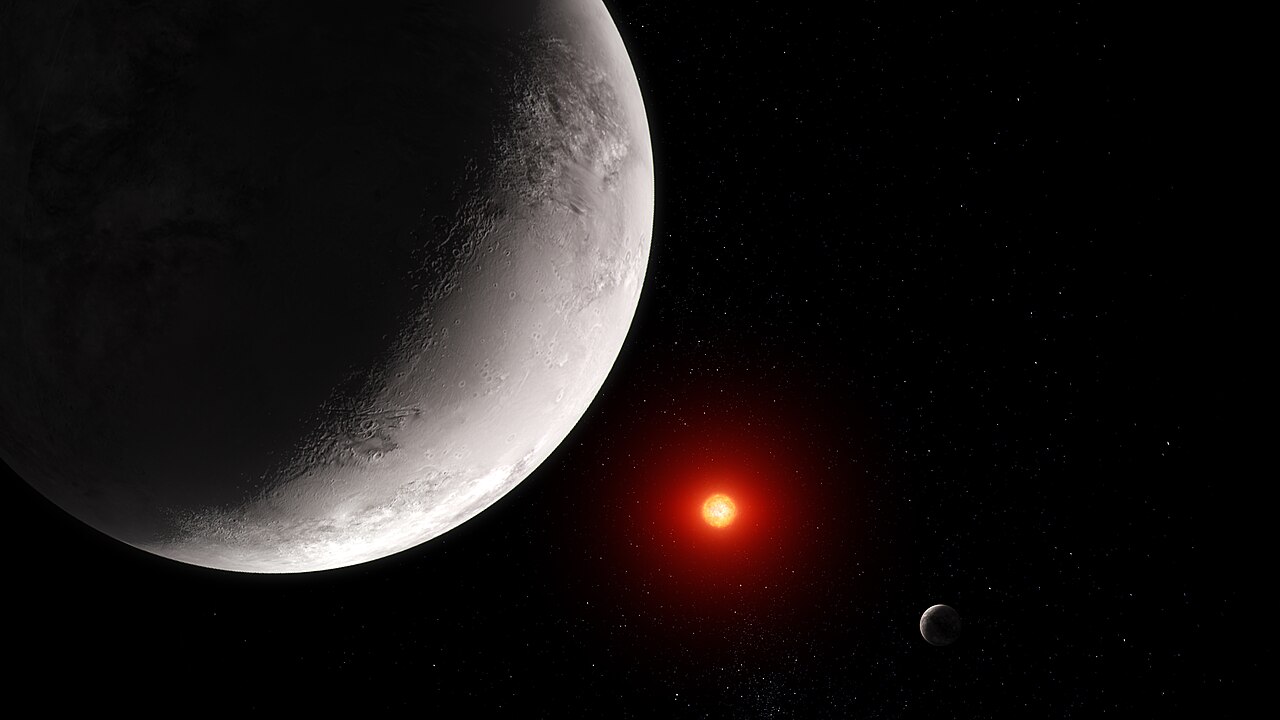
5 · The Orion Arm
the Sun, ~26,000 light-years from the galactic centerOur neighborhood within the galaxy: a minor spur between the Sagittarius and Perseus arms. We are not on a major arm nor near the center: we live in a suburb.
How we know: the Gaia mission measured positions and motions of ~1.8 billion stars; radio astronomy pins down the arms with maser parallaxes. [DATA]
6 · The Milky Way and its halo
disk ~100,000 light-years · halo, hundreds of thousandsThe bright disk is only the visible part: a halo of dark matter, several times more massive than everything that shines, wraps the galaxy and marks its true gravitational frontier.
How we know: rotation curves do not fall as visible matter predicts (Rubin & Ford, 1970s); streams of stars torn from dwarf galaxies trace the halo in Gaia data. [MODEL]
7 · The Local Group
~10 million light-yearsOur gravitational family: the Milky Way, Andromeda (2.5 million light-years away), Triangulum, and dozens of dwarf galaxies. The Milky Way and Andromeda are approaching: they will collide in about 4.5 billion years.
How we know: distances from Cepheids and the tip of the red giant branch; the group's motions are charted by the Cosmicflows program. [DATA]
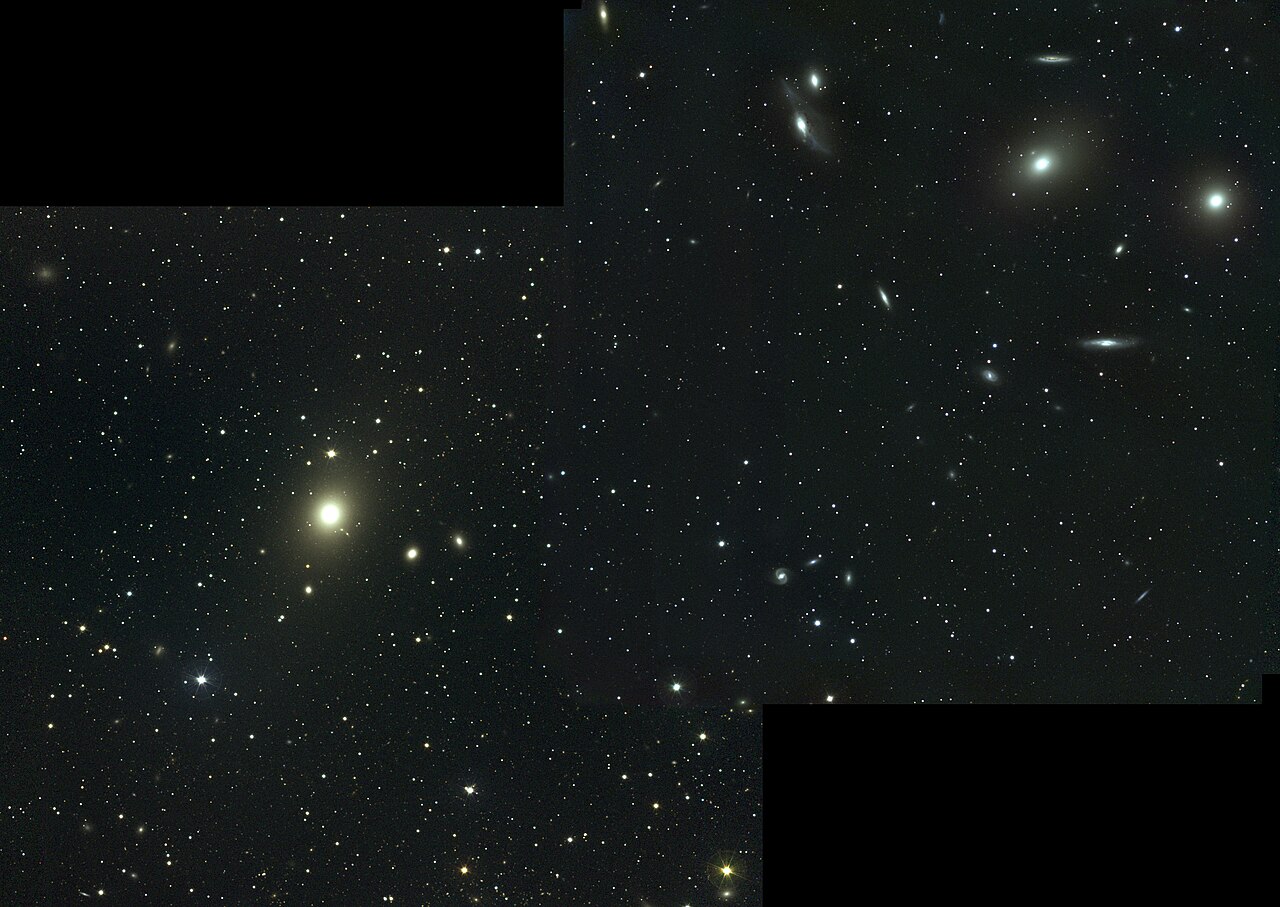
8 · The Virgo Cluster
~54 million light-years away · ~1,500 galaxiesThe first great galaxy city on our map: some 1,500 galaxies bound by gravity, with the giant elliptical M87 at its center. The entire Local Group is falling toward it, pulled by its mass.
How we know: distances from Cepheids and the Tully–Fisher method; the infall flow of neighboring galaxies is measured by the Cosmicflows program. [DATA]
9 · Laniakea
~500 million light-yearsThe supercluster that contains us: some 100,000 galaxies whose motions flow toward a single gravitational basin, the Great Attractor. Its border is not a wall: it is defined by where each galaxy flows, like a watershed.
How we know: Tully et al. delineated it in 2014 (Nature) using thousands of peculiar velocities from the Cosmicflows catalog. [MODEL]
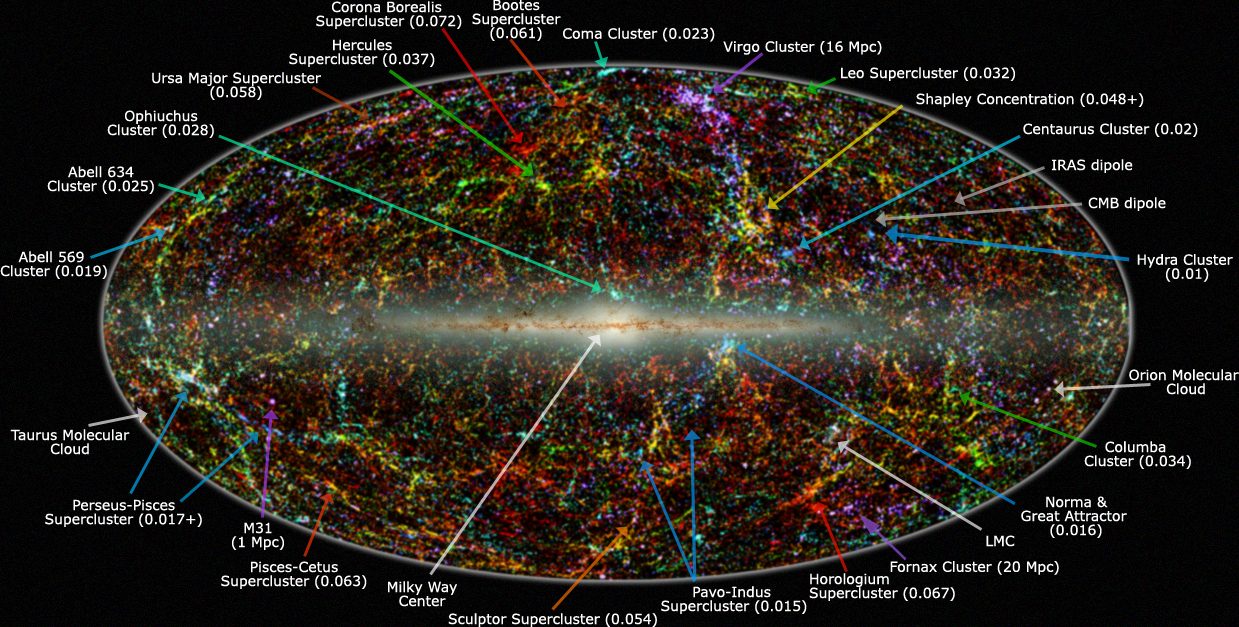
10 · The cosmic web
filaments billions of light-years longAt large scales, matter orders itself into filaments — the "rivers" along which gas and galaxies flow — with clusters at the nodes and enormous voids between them. Beyond ~300 million light-years, the pattern smooths out: the universe becomes homogeneous.
How we know: galaxy maps from SDSS and DESI, which sample the cosmos in survey wedges, reproduce the same web as simulations (Millennium). This is the layer where our map shifts from census to statistics: we know the pattern, not the inventory. [DATA]
11 · The observable sphere
radius ~46.5 billion light-yearsEverything light has had time to bring us: a sphere centered on the observer — every observer, in any galaxy, has their own. Its surface is the cosmic background: light released when the universe turned transparent, 380,000 years after the Big Bang, now cooled to 2.725 K. Looking far away is looking into the past, in concentric layers of time.
How we know: the age of 13.8 billion years comes from integrating the expansion measured by the Planck satellite, and it agrees with independent methods: the oldest globular clusters, white dwarf cooling, nuclear dating of ancient stars. Different rulers, the same number. [DATA]
12 · The whole?
unknown sizeThe last layer is not a layer: it is the question. Measured spatial curvature is flat, which allows a whole that is infinite, or far larger than the observable sphere. No edge and no center have been detected. Everything above fits inside this question mark.
How we know: we don't yet. This layer has no node that closes it: it is the honest edge of the map. [QUESTION]
The zoom: stepping down in scale
The 3D model in section 1 cannot show these layers from inside: between the observable sphere and the Oort cloud there are ten orders of magnitude. The atlas solution is to change maps. That is what the following zooms do: each declares its frame, and inside that frame distances become true again.
Zoom 1 · The galaxy and the Local Group — frame: 10 million light-years
The first zoom steps down from the observable sphere to the group of galaxies we live in: two giants — the Milky Way and Andromeda — surrounded by named satellites. Distances between galaxies are to scale; the disks are exaggerated so they can be seen, and that is declared.
Scale honesty: distances between galaxies are to scale (1 unit = 100,000 light-years) and directions come from their approximate equatorial coordinates; galaxy disks are exaggerated ×5–×10 to be visible — at true scale they would be points. The smaller dots are real dwarf galaxies of the group (Sagittarius, Fornax, Sculptor, Draco, Ursa Minor, Carina), unlabeled for economy of space.
Zoom 2 · The stellar neighborhood — frame: 300 light-years
Here the Oort cloud finally shows: the shell of comets wrapping the solar system. And around it, the named neighboring systems, placed by their coordinates and at true distances from each other: the neighborhood where we already find known material.
Scale honesty: distances between systems are to scale (1 unit = 3 light-years) and directions come from their approximate equatorial coordinates; star sizes are exaggerated. The Oort cloud and the Local Bubble are declared models.
3 · The human measure: our probes
Between layer and layer there is one measure that puts everything in proportion: the farthest anything built by humans has ever reached. The Voyager probes, launched in 1977, crossed the heliopause — they left layer 2 — and they are still traveling. One important precision: they have not left the Local Bubble (layer 4); they are still inside it and will remain inside for thousands of years. Confusing those two borders is the most common error in telling their journey.
- Voyager 1 (today): ~170 AU from Earth, some 25 billion km. Its signal, at the speed of light, takes ~24 hours to arrive. The figure grows every day.
- Voyager 2 (today): ~145 AU, in another direction.
- Their next border: the inner edge of the Oort cloud (from ~2,000 AU) — they are some 300 years of travel away from it.
- The nearest star (Proxima Centauri): 268,000 AU, or 4.24 light-years. At the Voyagers' pace, covering that distance would take tens of thousands of years.
Put on this piece's scale: if the observable sphere were the size of Earth, everything Voyager 1 has traveled would be less than the size of a bacterium. That is, today, the most exact representation of how far we have reached against the immensity of the observable. [DATA]
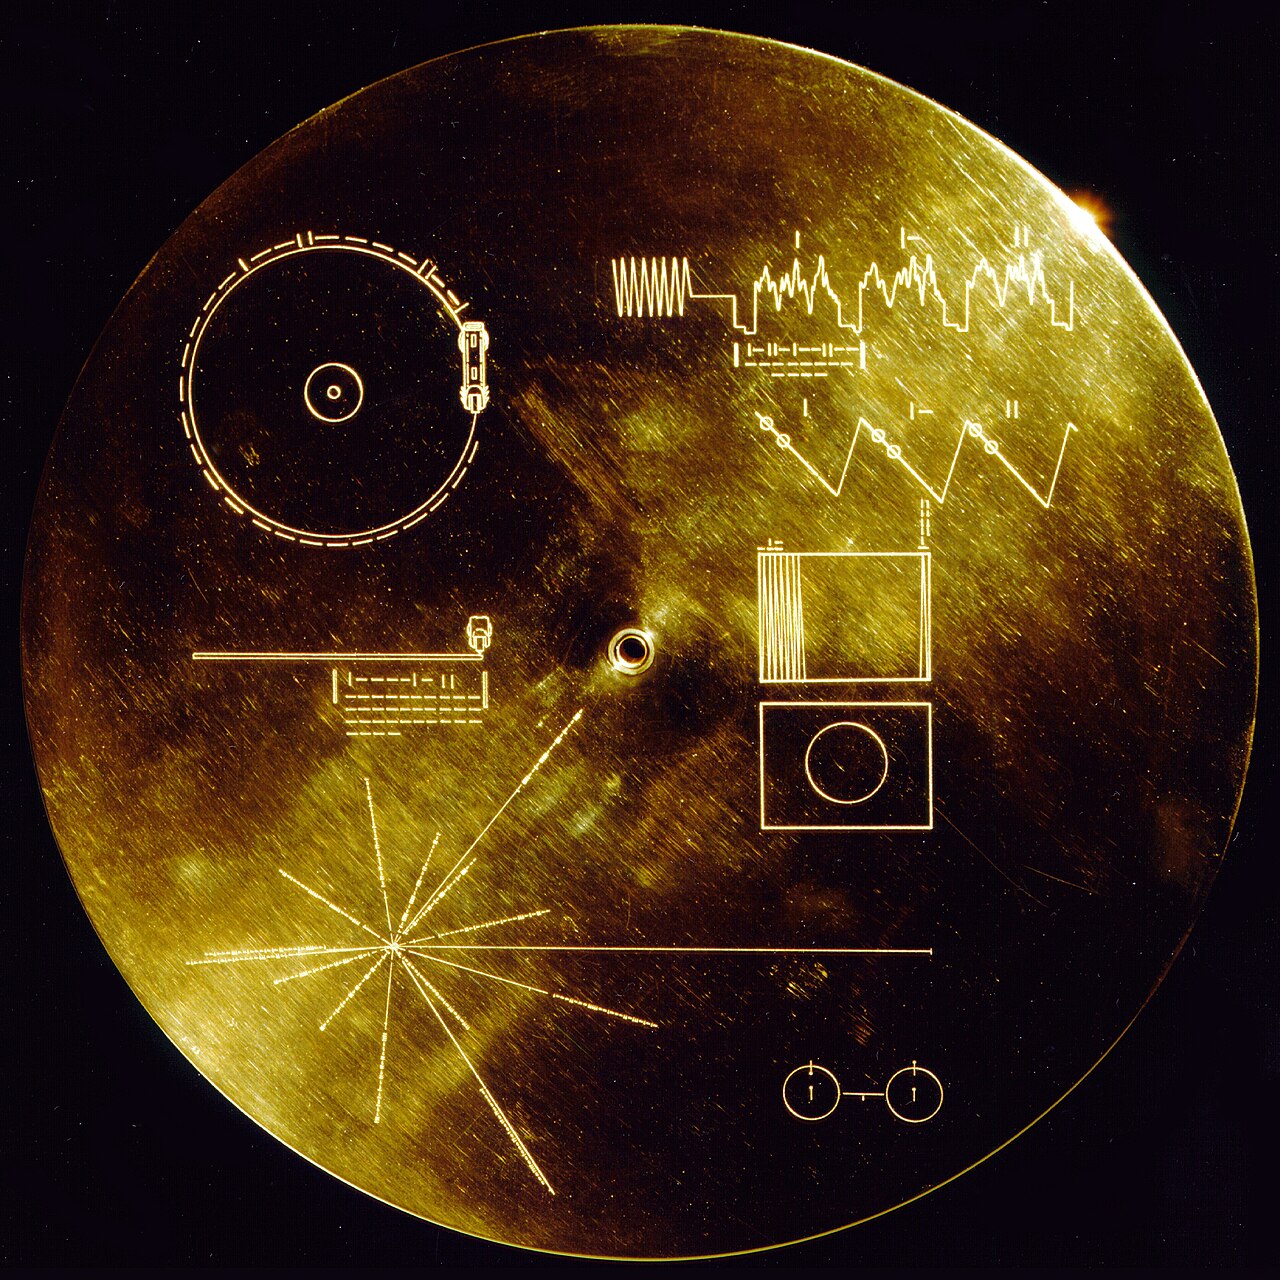
The probes' model: the solar system in its frame
This is the Voyagers' journey, drawn: a frame 200 AU in radius where orbits and distances are to scale with each other. The whole solar system — from the Sun to the heliosphere — fits in the lowest rung of this piece's ladder of models.
Scale honesty: orbits and distances are to scale within the frame (1 unit = 2 AU); the Sun and planets are exaggerated to be visible, and the Voyagers' directions are schematic (1 north of the ecliptic, 2 south). The Oort cloud does not fit in this frame: it begins some 100 times farther than its edge — it is the territory of the neighborhood model (zoom 2, in the previous section).
4 · Looking from inside, and backward
The observer is inside the map
Each layer filters what we see of the next ones. The measurable example: dust in our own galaxy blocks ~20% of the extragalactic sky in visible light — astronomers call it the Zone of Avoidance — and it can only be crossed with infrared and radio. Like a fish describing the ocean from inside the water: our coordinates, our instruments, and our own bubble are part of the instrument. [DATA]
The other axis: layers of time
Looking far away is looking back, so the observable sphere is also an onion of epochs: Andromeda's light left 2.5 million years ago; distant galaxies' light, billions of years ago (we see them young); the cosmic background's light left 13.8 billion years ago, when the universe was 380,000 years old.
And there is a frontier light cannot cross: before that shell, the universe was opaque. Those time layers are not empty of information — they could be read in other messengers (the cosmic neutrino background, primordial gravitational waves) that we cannot yet capture. [QUESTION]
5 · Declared nodes
- Planck Collaboration (2020) — cosmological parameters: the universe's age (13.8 billion years), flat geometry, and the expansion rate from which the observable sphere's diameter is derived.
- NASA / JPL — Voyager 1 (2012) and Voyager 2 (2018) — the measured heliopause crossing: a jump in galactic cosmic rays and a change in the plasma.
- SDSS and DESI — galaxy cartography in survey wedges; tens of millions of measured distances against an estimated 200 billion or more galaxies in the sphere.
- Cosmicflows-4 (Tully et al.) — distances and peculiar velocities of the cosmic neighborhood; the basis of Laniakea (Tully et al., Nature, 2014).
- Zucker et al. (Nature, 2022) — the Local Bubble and its origin in ~15 supernovae.
- Gaia (ESA) — positions and motions of ~1.8 billion stars: the Milky Way's structure, its halo, and its streams.
- Rubin & Ford (1970) — galactic rotation curves: the classic evidence for the dark matter halo.
- Oort (1950) — the comet cloud deduced from long-period orbits: layer 3 rests on this inference, still without direct observation.
- Virgo Cluster — distance of 16.5 Mpc from Cepheids and Tully–Fisher; its central galaxy, M87, is the first whose black hole was photographed (Event Horizon Telescope, 2019).
- Millennium Simulation — the cosmic web reproduced from measured initial conditions.
State of the piece: layers 1, 2, 5, 7, 8, 10, and 11 rest on direct measurement or cross-checked methods; layers 3, 4, 6, and 9 are models well supported by those data; layer 12 remains open. The 3D visualization is a didactic representation, not a to-scale map (see the honesty note under the graphic).
6 · This piece's challenge: find the flaw
This piece is a compilation: measured data and declared models, traced to their nodes. We know from our own experience — the "broken telephone" between a publication, a book, and a web page — that something can twist in every copy.
So the question stays open, especially to those who work with these instruments daily: if you find a flaw — a miscopied datum, a figure that does not square with its node, a leap in the logic of the layers — say it, with the evidence. The correction is integrated into the piece and the corrector is recorded by name or pseudonym, as this house's method prescribes and as already happened with the first external correction this laboratory received. Criticize the idea, never the person; a correction with evidence always wins.
How to take part: read the community rules, bring your correction through the publishing route, or write to us at contacto@mathvsmyth.com. The piece is free (CC BY 4.0): anyone can learn from it, explore it, and — most valuable of all — correct it.